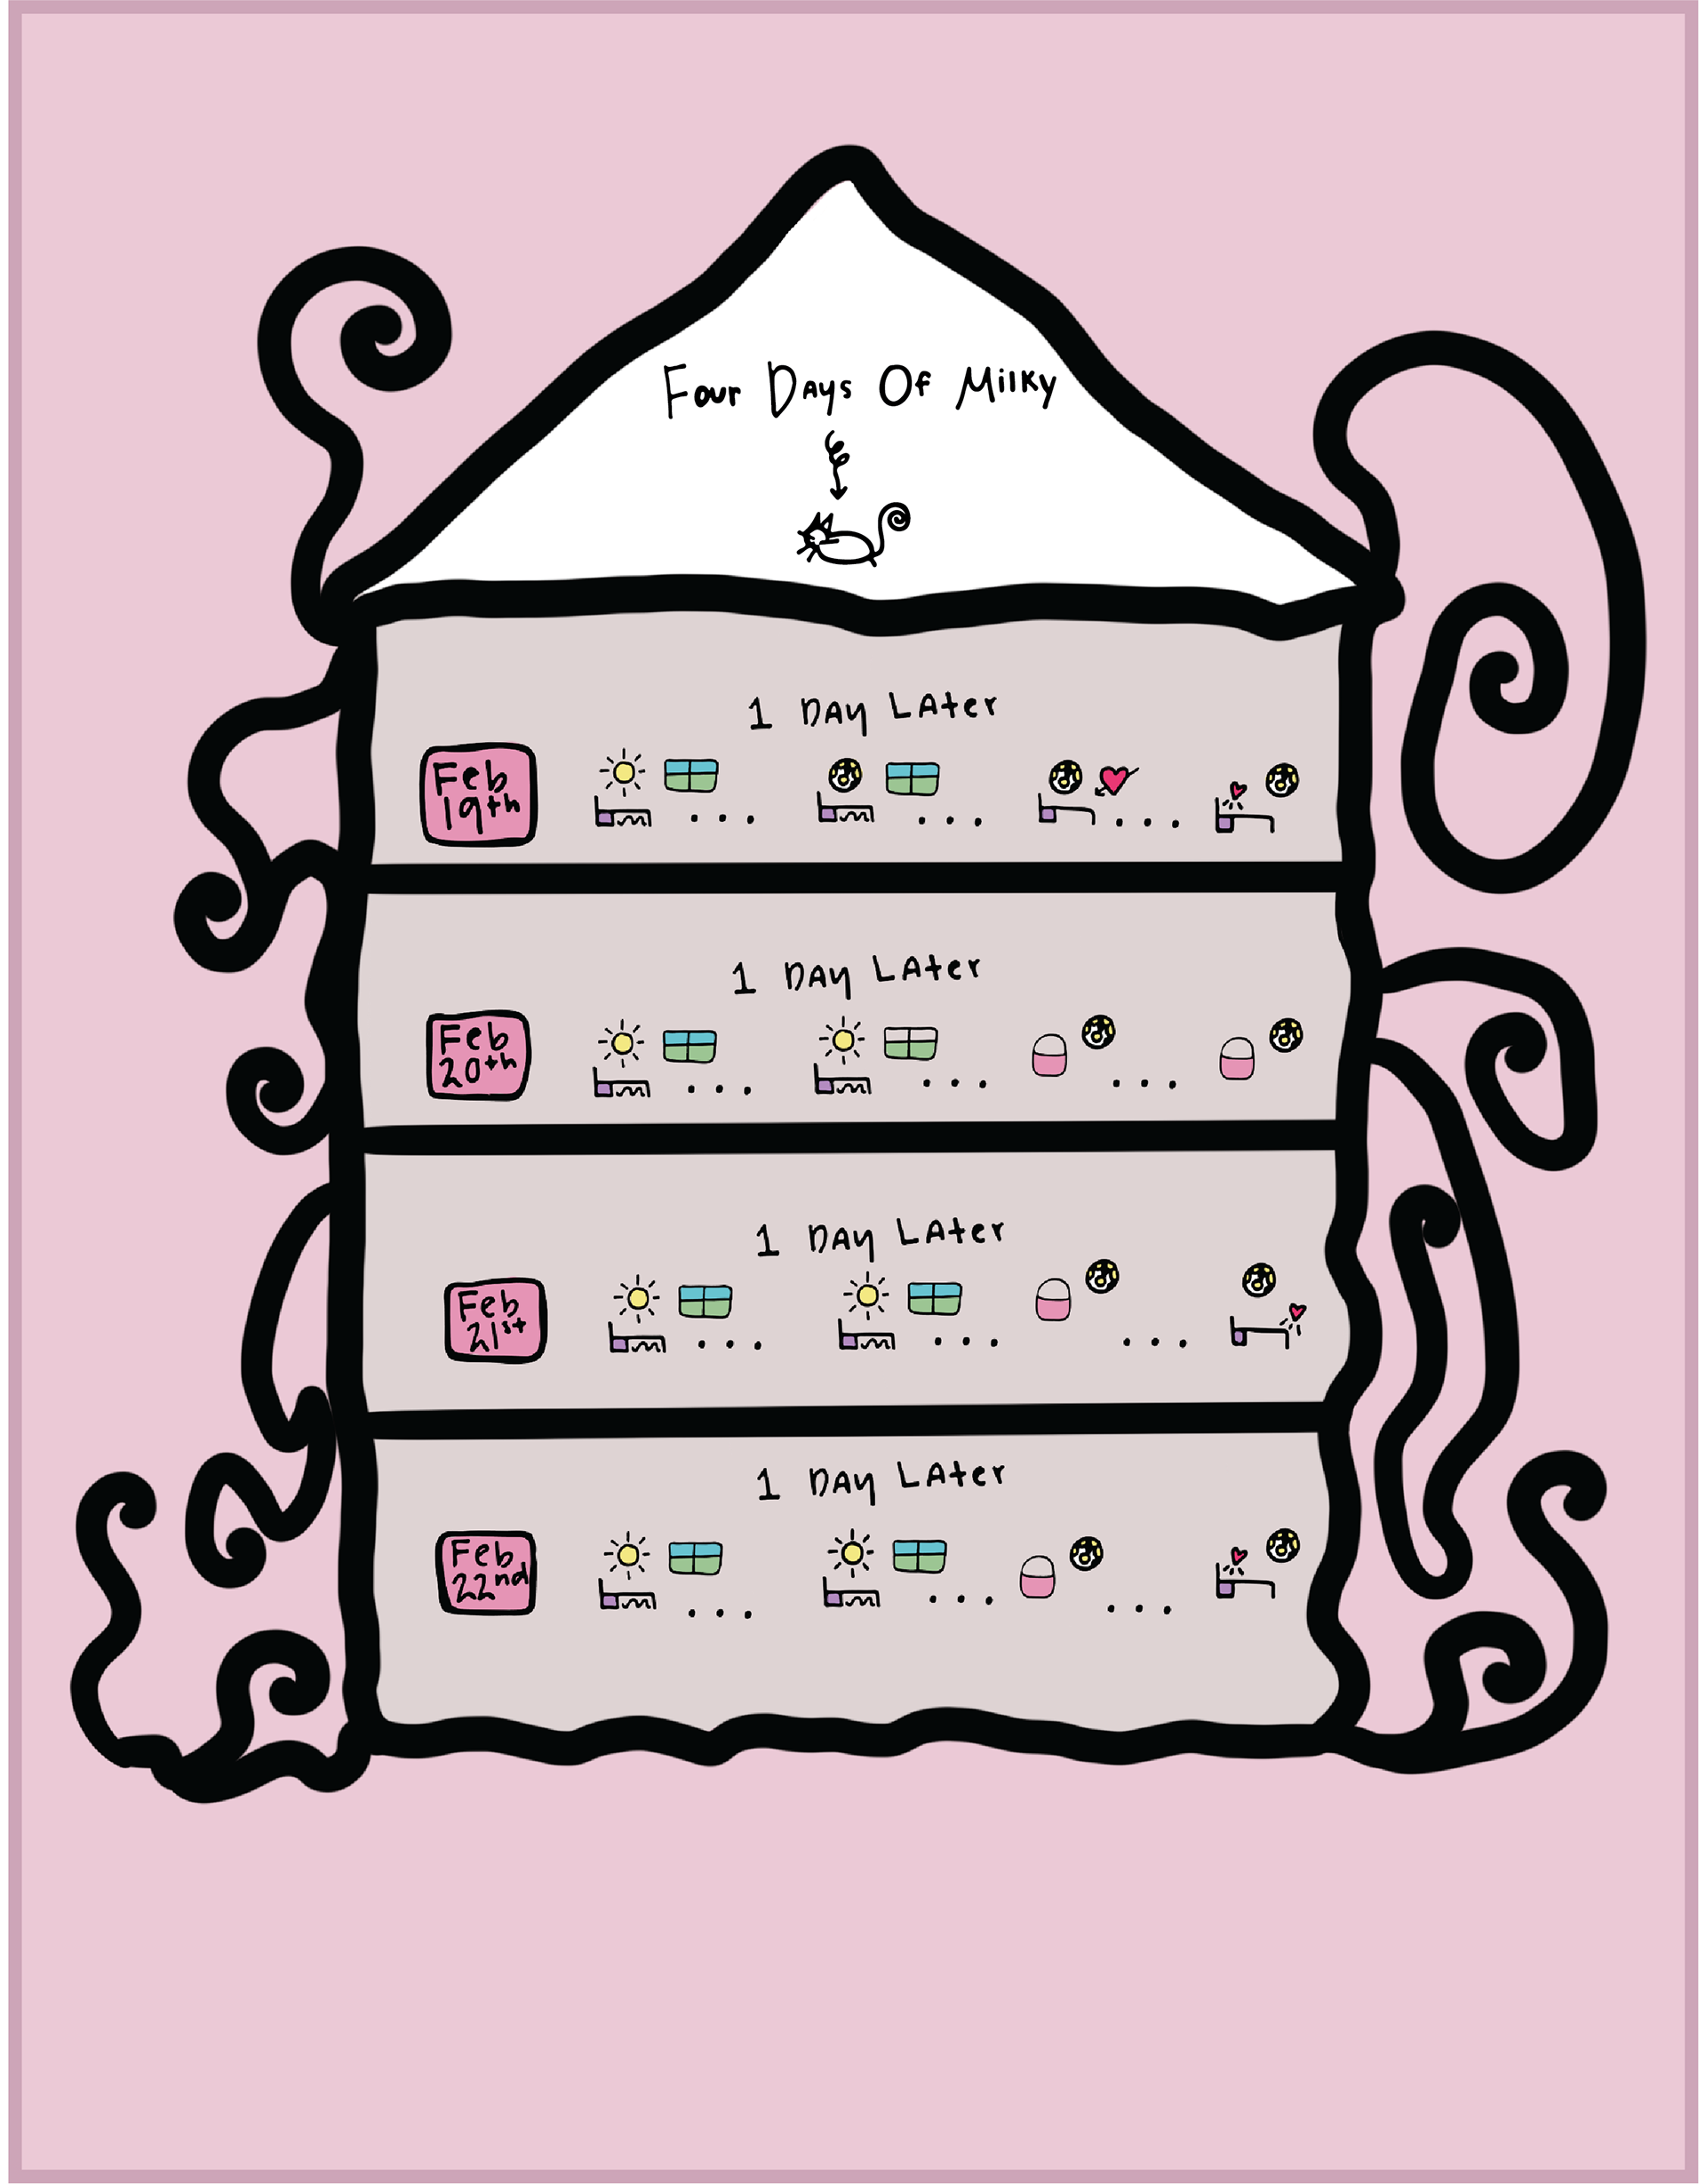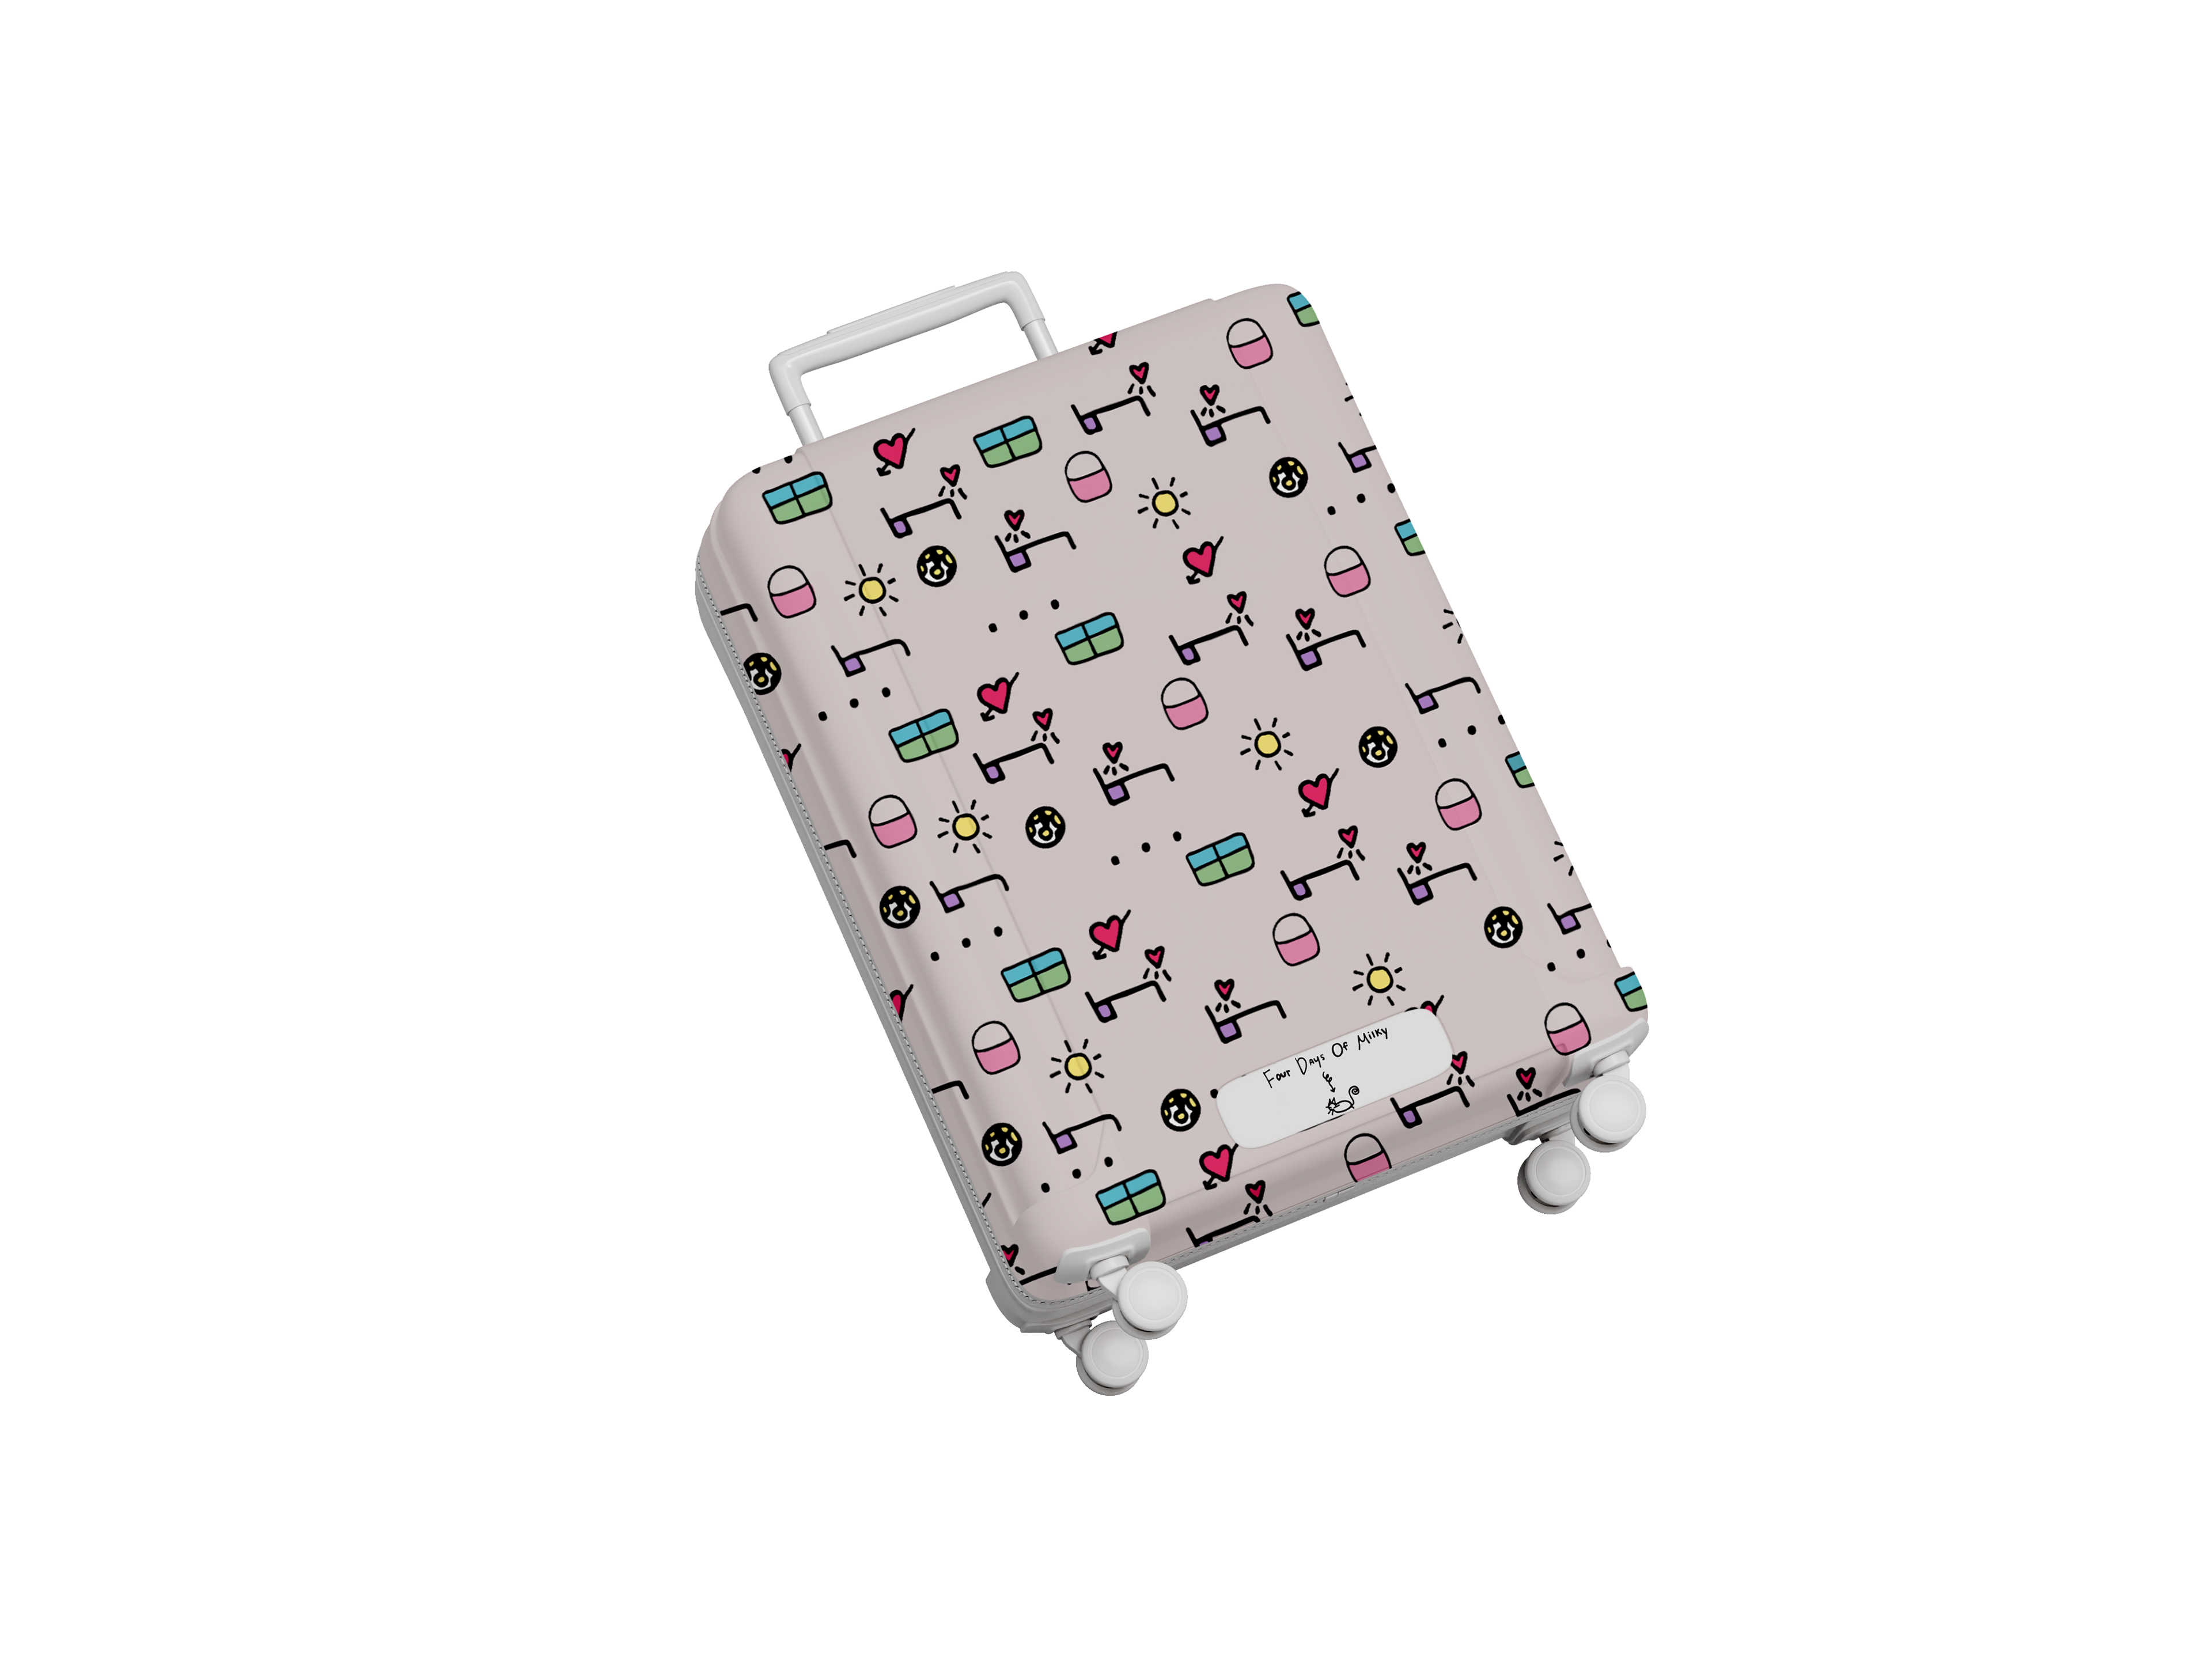
This case involved exploring data visualization. This meant creating a unique use of iconography to display data in an aesthetically pleasing way, and in a way that could be understood by analyzing the pattern of icons through the assistance of a clearly established and labeled key. For the data in this case, four days of different places that Milky the cat sleeps in were collected. This data was then extended into a merchandise line using the icons from the data visualization graph. For these objects in particular they are home and cat goods.